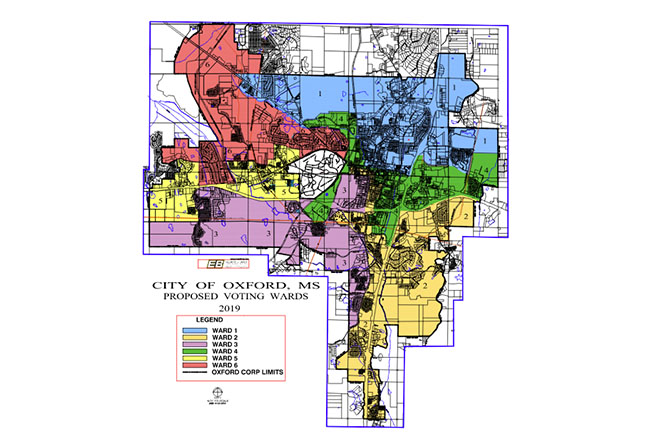
City approves revised voting wards map
Published 10:17 am Friday, October 18, 2019
- If the population distribution exceeds 10% from the lowest to highest wards, then the district lines will need to be redrawn to be in the acceptable range.
After deciding to seek outside help in the City’s efforts to redistrict during the summer, the Oxford Board of Aldermen approved a revised map on Tuesday.
In July, the City’s chief operating officer, Bart Robinson, recommended the Board hire an outside firm to develop a new district map after the Redistricting Committee’s proposed map, with help from Three Rivers Planning and Development, failed to meet the Board’s requirements within the six wards.
The wards are to have no more than a 10 percent variance in population, but the committee was unable to get the variance below 13 percent. In an effort to find a way to accommodate that requirement, the City asked a former city planner to assist them. Ben Smith, of Elliott & Britt Engineering, presented a new map with a variance of 7.15 percent.
Smith dealt with the same challenges as the committee: using the numbers from the 2010 Census. In the nine years since the last census, Oxford has grown by nearly 6,000 people.
“I took (the previously proposed map) and through trial and error in certain areas, obviously those were deficient in population I had to add census blocks to those wards and the ones that had high populations and I had try and reduce them,” Smith said. “The end result was that I managed to get the deviation down to 7.15 percent.”
The newly-approved map will be used for around two years, as the City will have to await the results of the 2020 Census. The numbers may not be enough to warrant the creation of new voting districts from what was approved on Tuesday, but they may not be released until spring of 2021.
City elections will be held in 2021, and Smith informed the board they will more than likely use this map and not a new map, which would be based on the 2020 Census numbers.
The City tries to have one minority-majority ward among the six. Ward IV is usually that district, due to the demographics that live within it, but Smith said even with his revisions the Ward has a 52 percent population of white residents and a 48 percent population of minority residents. That is still a slight improvement from the map the City was currently using (53-47), prior to Tuesday’s approval.
Residents who want to view the new map and see if they now reside in a new voting ward can click here.
More News Main


-
-
-
Polls
 Loading ...